SOFTWARE PRODUCTS
The Near Infrared Research Corporation provides computer programs to train, or calibrate spectrometers to perform chemical analysis using methods that are unavailable in other software packages. These programs provide unique advantages over the more common PCR and PLS methods in the areas of speed, cost, linearity and regulatory acceptance. Our programs include the most extensive wavelength search capability of any modern software package, both for quantitative and qualitative calibration algorithms.
*** NEW: Demonstration version of Conformity Index now available for download ***
*** NEW: Linearity testing ***
MLR QUANTITATIVE ANALYSIS
"MLR" is the abbreviation used to describe the use of individually selected wavelengths to perform instrument training for spectroscopic calibration. The MLR algorithm has been shown to provide better calibrations when the data contains non-linearities, as well as conferring other advantages. The Near Infrared Research Corporation provides a unique implementation of the MLR calibration algorithm, one that includes several wavelength search capabilities not otherwise available.The advantages of MLR over other calibration methods is its speed of analysis, cost and resistance to the effects of nonlinearity. Click here for more infomation explaining the advantages of MLR over other calibration methods.
The inclusion of two unique cutting-edge wavelength search algorithms MLR software provides unparalleled flexibility for selecting the best wavelengths at which to perform your analysis:
Click here for a typical output from quantitative analysis
Click here to download an evaluation version of these programs, including instructions and test data. This has all the features and capabilities of the full operating programs, subject to the following limitations compared to the full working version:
1) It displays the results in a window, instead of writing them to a model (equation) file. Because of this, only calibrations, and not predictions, can be performed on your own data, when using the evaluation software. In order to operate and test the prediction program, one equation file, for the included test data, is also included.
2) The evaluation version is written in 16-bit C, whereas the operating version is written in 32-bit C. Therefore the operating version executes considerably faster than the evaluation version.
3) Because the evaluation version is written for 16-bits, it can only handle spectra with up to 2048 wavelengths, but the operating version does not have this limitation.
ADVANTAGES OF MLR
SPEED: Analysis using MLR is accomplished faster than algorithms that require full spectra. This is due to the fact that during routine analysis, data at only a few wavelengths need be measured, rather than the full spectrum. Because of this, it is ideally suited when high-speed measurement capability is needed, and also when interference-filter instruments are used, or other technologies that provide the capability to measure prespecified wavelengths, such as AOTF, LED or diode array-based units. The MLR calibration software we provide assists the user in selecting the wavelengths to use.
COST: Our software is low-cost, typically 1/3 the price of other calibration software, or less. In addition, the inherent compatability with inteference-filter and other instruments that measure individual wavelengths means that its use with these lower-cost instruments provides a premier opportunity to utilize lower-cost technology for routine analysis, especially in an on-line, real-time situation.
REGULATORY: Published literature indicates that being able to specify wavelengths corresponding to known absorbance bands is an acceptable way to satisfy the Specificity requirements of regulatory agencies, for an analytical method. In addition, anecdotal reports indicate that in some cases, regulatory agencies prefer the use of individual wavelengths that can be related to the known chemical and spectroscopic properties of the samples being analyzed, over the non-specific models generated by other calibration methods. This consideration becomes particularly meaningful for companies starting to consider implementation of the FDA's new PAT initiative. Click here for the FDA web site on PAT.
LINEARITY: The realization that non-linearity was the "mystery" effect causing MLR to be superior to PLS or PCR in some cases (for then-unknown reasons) was first reported in a "Chemometrics in Spectroscopy" column (Spectroscopy, 13(6), p. 19-21 (1998)). Click here to download a copy of that initial column and demonstration of the resistance of MLR to non-linearity.
This column was shortly followed by considerable controversy and resulting discussion over this topic, which required several followup columns to print.
Click here for the first followup column. (Spectroscopy, 13(11), p. 18-21 (1998))
Click here for the second followup column. (Spectroscopy, 14(1), p. 16-17 (1999))
Click here for the third followup column. (Spectroscopy, 14(2), p. 16-27, 80 (1999))
Click here for the fourth followup column. (Spectroscopy, 14(3), p. 12-13 (1999))
Click here for the fifth followup column. (Spectroscopy, 14(6), p. 12-14 (1999))
MAHALANOBIS DISTANCES FOR QUALITATIVE ANALYSIS
Mahalanobis Distance is the name used to describe the "closeness" of two spectra, by using several individually selected wavelengths. If the spectrum of an unknown material is "close enough" to the spectrum of a known material, it can be identified as being that material. The Near Infrared Research Corporation provides a unique implementation of the Mahalanobis Distance algorithm, one that includes several wavelength search capabilities not otherwise available.Advantages of Mahalanobis Distances include speed, cost, proprietary considerations, and use of wavelengths assignable to defined functional grups of chemical species.
SPEED: Analysis using Mahalanobis Distances is accomplished faster than algorithms that require full spectra. This is due to the fact that during routine analysis, data at only a few wavelengths need be measured, rather than the full spectrum. Because of this, it is ideally suited when high-speed measurement capability is needed, and also when interference-filter instruments are used, or other technologies that provide the capability to measure prespecified wavelengths, such as AOTF, LED or diode array-based units. The calibration software we provide assists the user in selecting the wavelengths to use.
COST: Our software is low-cost, typically 1/3 the price of other calibration software, or less. In addition, the inherent compatability with inteference-filter and other instruments that measure individual wavelengths means that its use with these lower-cost instruments provides a premier opportunity to utilize lower-cost technology for routine analysis, especially in an on-line, real-time situation.
REGULATORY: Published literature indicates that being able to specify wavelengths corresponding to known absorbance bands is an acceptable way to satisfy the Specificity requirements of regulatory agencies, for an analytical method. In addition, anecdotal reports indicate that in some cases, regulatory agencies prefer the use of individual wavelengths that can be related to the known chemical and spectroscopic properties of the samples being analyzed, over the non-specific models generated by other calibration methods. This consideration becomes particularly meaningful for companies starting to consider implementation of the FDA's new PAT initiative. Click here for the FDA web site on PAT.
PROPRIETARY CONSIDERATIONS: These programs maintain the proprietary nature of your samples, your data and your analyses, since they allow you to create and save your own "libraries" of the spectra of the materials of interest. Neither the samples nor the data need ever leave your own facilities.
The inclusion of two unique cutting-edge wavelength search algorithms provides unparalleled flexibility for selecting the best wavelengths at which to perform your analysis:
Click here for a typical output from qualitative analysis
Click here to download an evaluation version of these programs, including instructions and test data. This has all the features and capabilities of the full operating programs, subject to the following limitations:
1) It displays the results in a window, instead of writing them to a model file. Because of this, only calibrations, and not predictions, can be performed on your own data, using the evaluation software. In order to operate and test the prediction program, one model file, for the included test data, is also included.
2) It is written in 16-bit C, whereas the operating version is written in 32-bit C. Therefore the operating version executes considerably faster than the evaluation version.
3) Because it is written for 16-bits, the evaluation version can only handle spectra with up to 2048 wavelengths, although the operating version does not have this limitation.
CONFORMITY INDEX CALCULATION AND USE
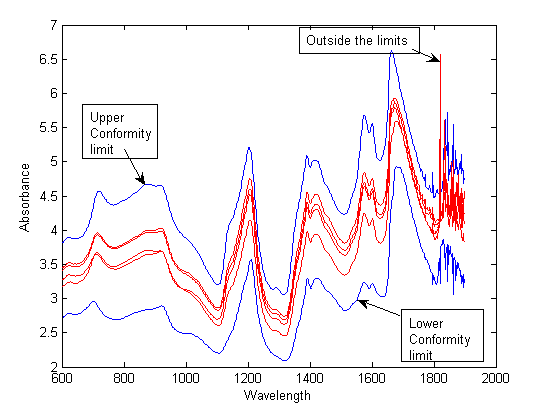
"Conformity Index" is a new, massively parallel univariate method of verifying whether the properties of the material under test conform to the properties of "known good" material. Since it is univariate, the use and interpretation of the results are much easier for the novice to comprehend and apply.The requirements for calculating a Conformity Index are similar to those for any Chemometric calculation: a "training set" of samples needs to be collected, and this training set must represent the variations of the samples that material of acceptable quality can achieve. When the spectra of these materials are collected into a database, the Conformity Index training calculations will distill the key characteristics of the data into a few numbers, which can be presented as spectra defining the limits of the acceptable material.
Once the database is analyzed this way, any sample can be compared with these Conformity values, to ascertain whether the new sample conforms to the properties of the training samples.
The concept was initially presented to the pharmaceutical industry by Plugge, W. & Van Der Vlies, C.; J. Pharm. Biomed. Anal.; 11(6); p.435-442 (1993) and was accepted as a validated test method. It was also re-examined more recently in an on-line journal by Ritchie, G.E., Mark, H., and Ciurczak, E.W.; AAPS PharmSciTech; 4(2); Article 24 (2003) (see: http://www.aapspharmscitech.org). The conclusion was that Conformity Index is recommended for use.
The Near Infrared Corporation provides the software that can perform all the necessary calculations for both training and routine use, and that also presents graphical results that enable the user to tell:
1) For conforming samples, you can ascertain how much margin the samples have.
2) For non-conforming samples, why they do not conform.
The following graph illustrates the identification of non-conforming samples, These four samples were flagged by the program from a larger set, the rest of which all conformed:

The Near Infrared Research Corporation has a license to distribute the software that implements this new method of evaluating whether your product conforms to its specifications. For more information, please contact us at:
Telephone: 845-357-9496e-mail: The Near Infrared Research Corporation, Inc.
You can download a demonstration version of this program by clicking here (approx 99 mbyte) to obtain an evaluation version of these programs, including instructions and test data. The evaluation software is fully operational except that it works only with the test data supplied.
Linearity Testing
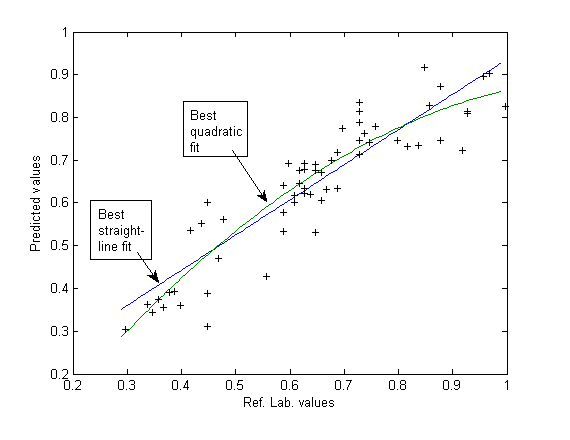
A series of articles in Spectroscopy magazine did a detailed examination of the recommended method of testing linearity as part of an FDA validation suite and found that the recommended methods, as well as other linearity tests found in the literature, were eminently UNsatisfactory. As part of the examination, a new test was devised. This new test is theoretically sound, completely objective, much more sensitive to non-linearity than the other tests, not easily fooled by other problems that might exist in the data and is easily adaptable to computer implementation, making it eminently suitable for automated application. Click here for the list of articles describing the limitations of current tests for linearity. The concept is also the subject of a recent patent (see: http://www.uspto.gov)Typical Linearity Test results are shown here:

The program also evaluates the differences numerically and calculates whether or not they are statistically significant.
The Near Infrared Research Corporation has a license to distribute the software that implements this new method of testing linearity, which is eminently suited to meet the requirements of the regulatory agencies. For more information, please contact us at:
Telephone: 845-357-9496
e-mail: The Near Infrared Research Corporation, Inc.